Field Deployments as part of SPECTRA
05/27/2015
The Canadian, Texas tornado event was one of the biggest and most photographed tornado events of 2015, as well as one of the most frustrating for this project. Poor road networks, flash flooding and police closing roads (for good reason, a mud slide) led to one one RADWIN being deployed, and no terrific data collected as it was about one kilometer from the circulation.

A look at the instrument and radar as the main tornado sat in open country to the northwest of the RADWIN. The RADWIN had a NE inflow wind at 45° which created a 0-1km helicity of 233m/s^2. The environment has a 146m/s^2 helicity. A good example how much inflow can change the storm environment.

The RAP analysis using BUFKIT of the environment the Canadian tornado was sitting in, specifically the hodograph. Notice the helicity stands at 146 m2/s2.

If the hodograph is updated using our instrument measurements at the surface, the helicity spikes to 233 m2/s2.

The RADWIN collects the RFD data as the canadian tornado begins the rope out.
![Data from a second RADWIN placed farther south. This is the raw data of the RFD killing the storm. Notice the significant increase in pressure [black] (+4mb in 15 minutes) and the rapid decrease in temperature (red) and dewpoint (green).](https://images.squarespace-cdn.com/content/v1/55a07bc1e4b082d0073d7444/1485595434598-ROJMF23MQJZWV9W4S403/image-asset.jpeg)
Data from a second RADWIN placed farther south. This is the raw data of the RFD killing the storm. Notice the significant increase in pressure [black] (+4mb in 15 minutes) and the rapid decrease in temperature (red) and dewpoint (green).
05/26/2015
The Metcalf Gap, Texas intercept was the first intercept following the foundation of the SPECTRA project. While most of the data is being withheld until further analysis and until this project is ready to go through a paper phase, I will post the raw data from one RADWIN that was caught between two tornadoes.
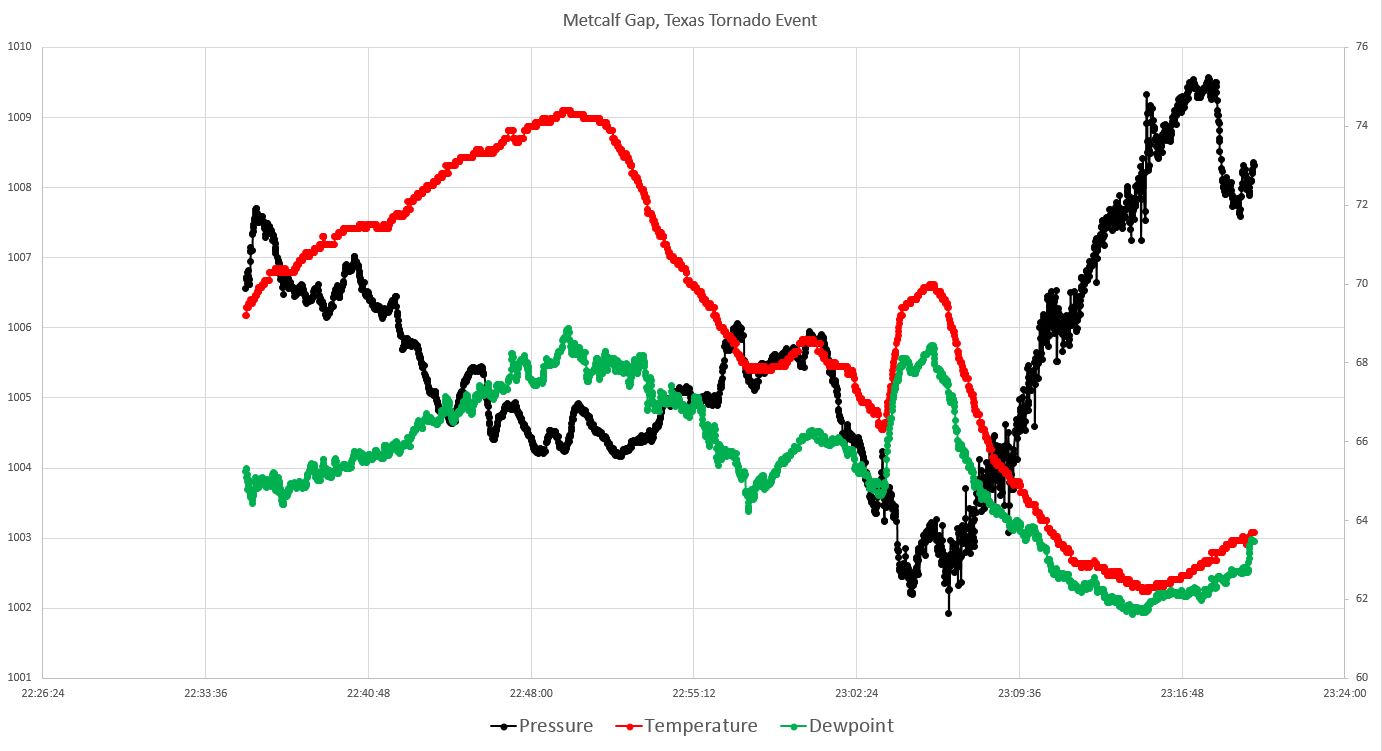
RADWIN data from the double tornado intercept. Notice the two fairly large pressure drops one right as the temperature/dewpoint spike, and another before the temp/dewpoint fall again.

A look at the instrument and radar as tornado #1 passes to the south of the RADWIN.

A look at the instrument and radar as tornado #2 passes to the north of the RADWIN. Both tornadoes were confirmed by storm spotters.
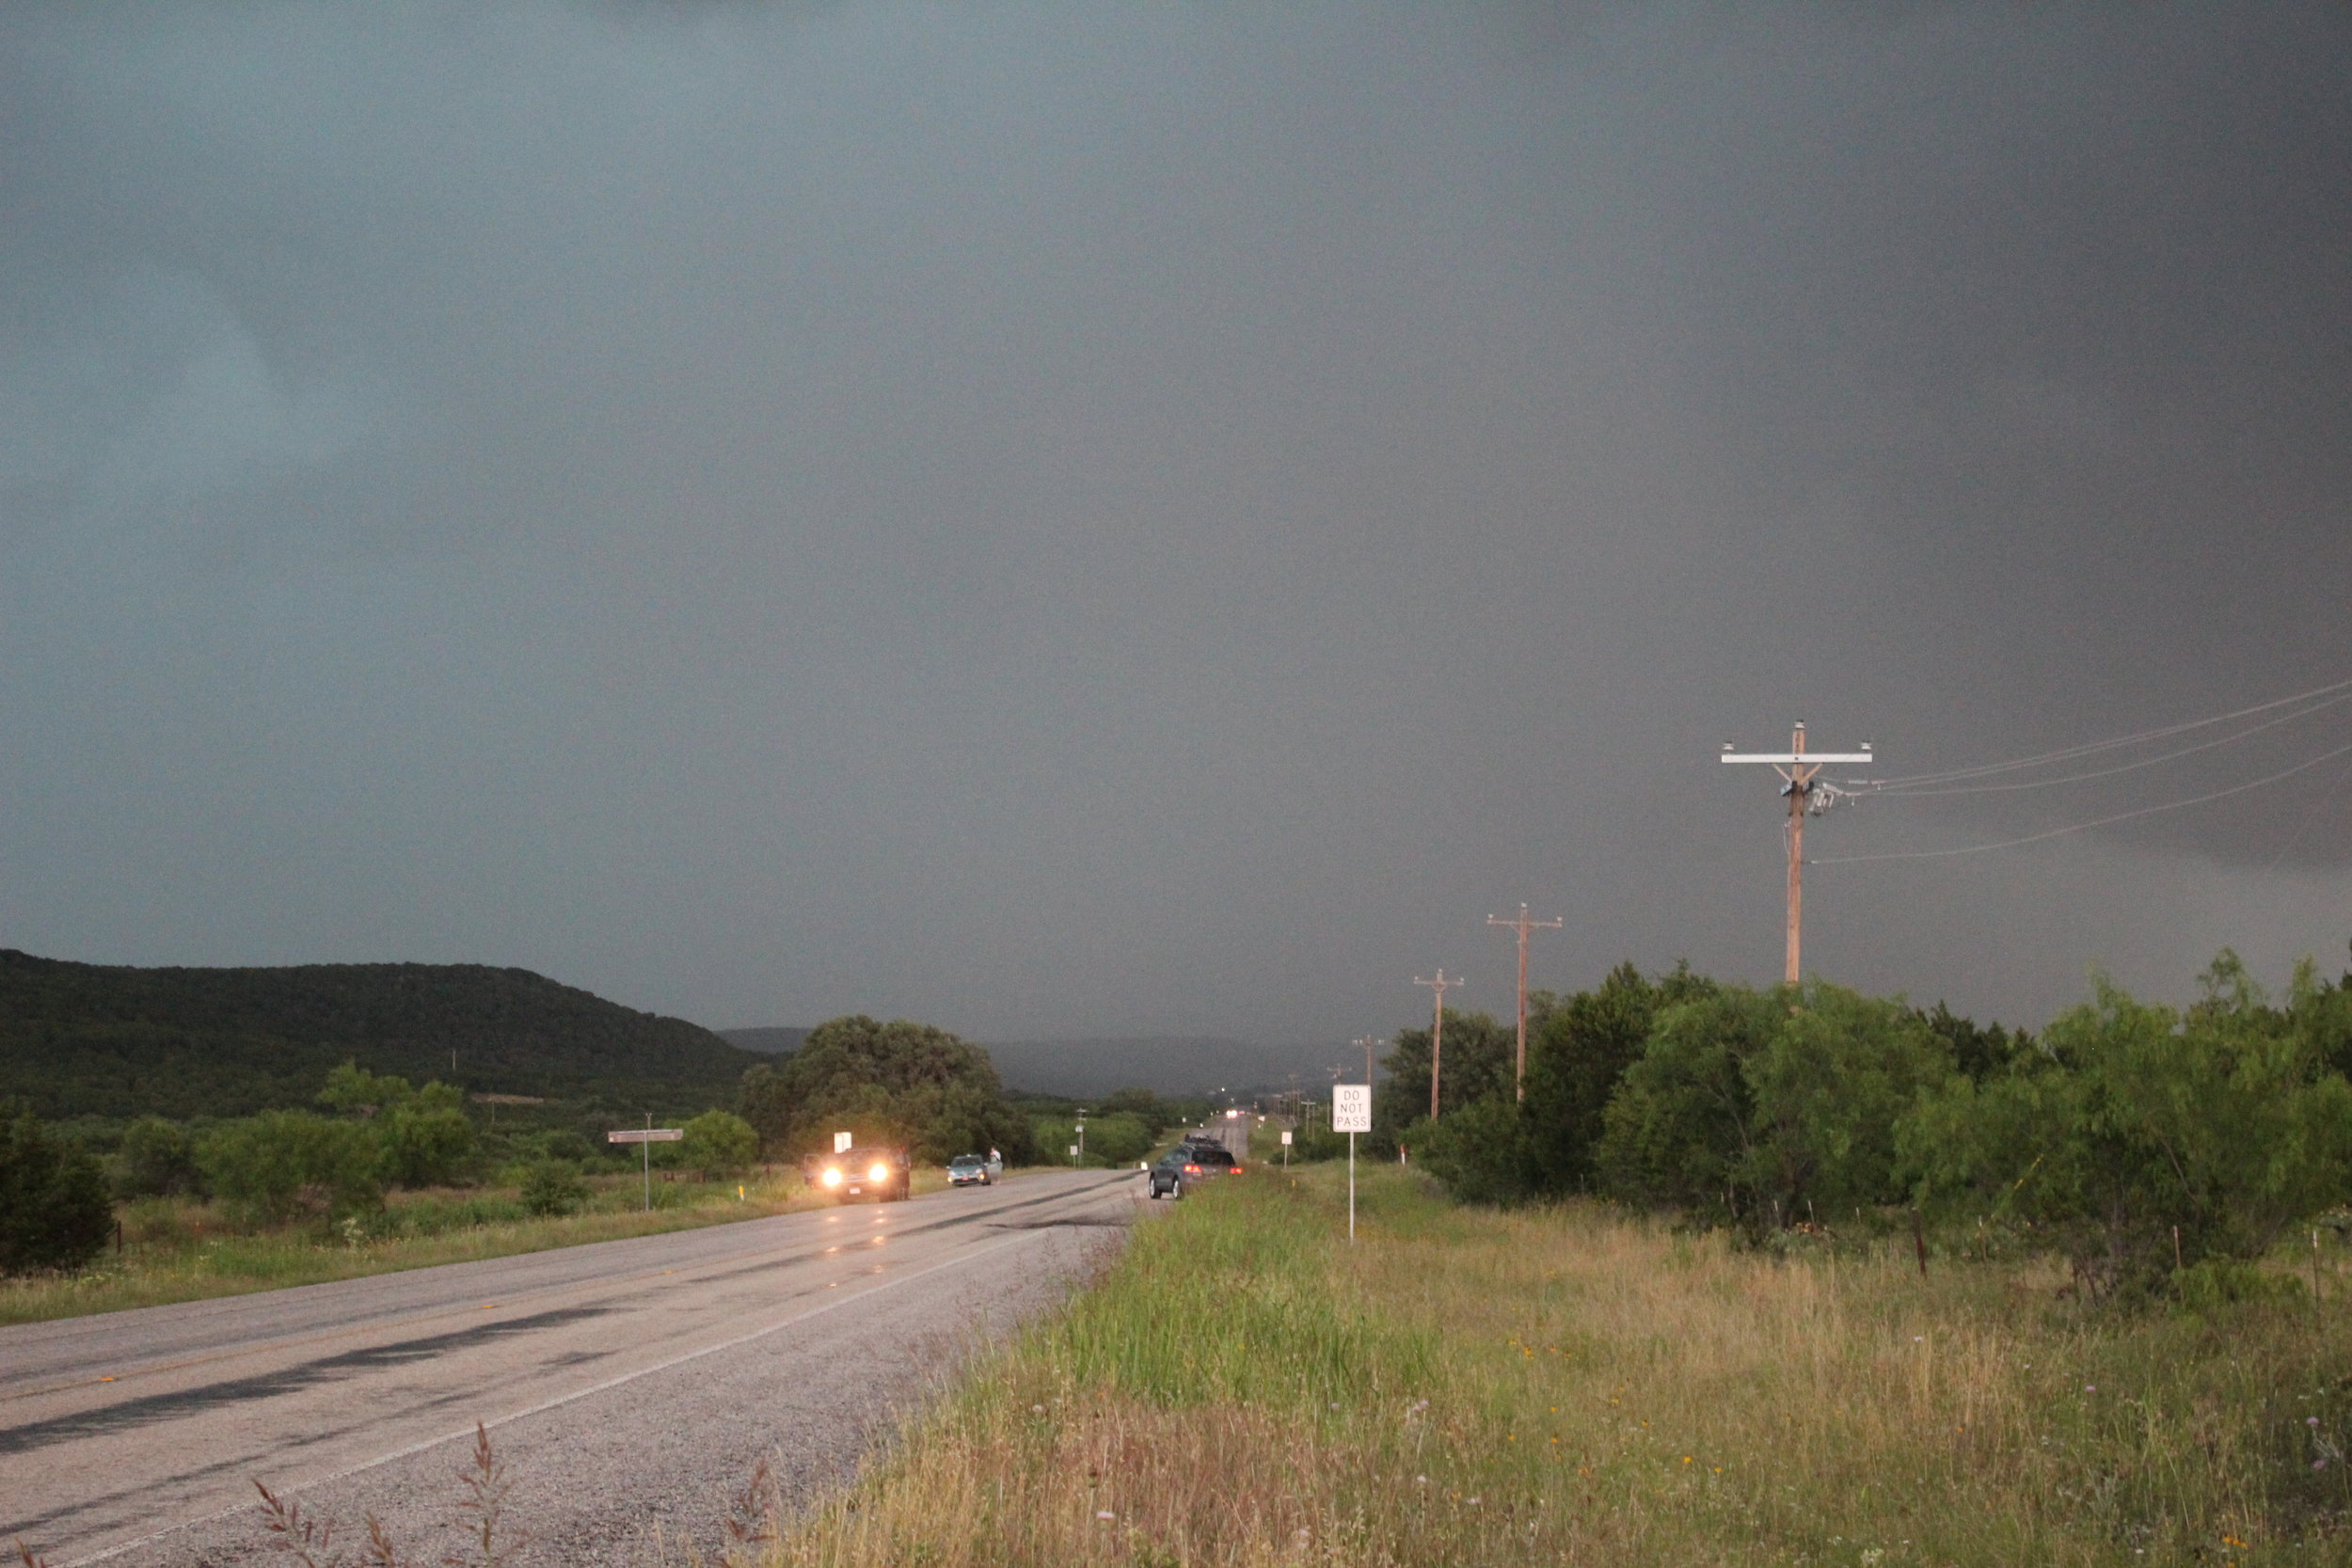
The RADWIN is down this road under the mesocyclone of the HP supercell.
05/11/2014
This was the original intercept that was a proof of concept. One probe was deployed and took a near-direct hit by a tornado. This is what led to the development of the SPECTRA Project

Data collected by first tornado probe on May 11, 2014. Things to notice: Significant quick pressure drop (6mb in four seconds). Under the tornadic circulation, dewpoint jumped while temperature dropped.

A picture of the satellite tornado of the main circulation that struck the instrument. You can clearly see the dust at the circulation's base and the funnel near the top of the picture. The tornado was not fully condensed.